Generic filters
Search in title
Search in content
Search in excerpt

Activity Diagram


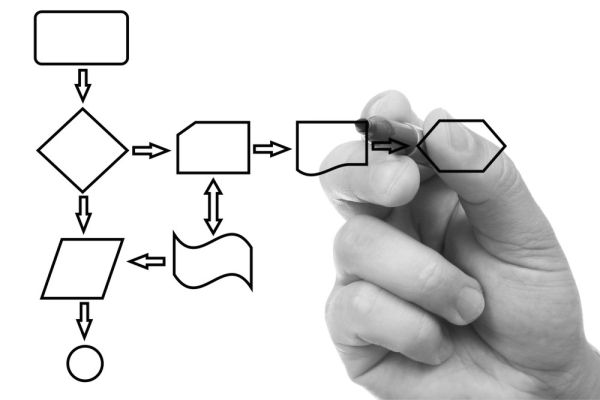
An Activity Diagram is a type of UML (Unified Modeling Language) diagram that visually represents a system’s processes, workflows, or operations, highlighting the control flow from one activity to the next. It’s like a flowchart that depicts a system’s behavior and the sequence of activities in a system, including choice, iteration, and concurrency.  

Activity Diagrams originated from the Unified Modeling Language (UML), a standardized general-purpose modeling language in the software engineering field.

UML was created to establish a common language for visualizing, specifying, constructing, and documenting software system artifacts. 

Roots in UML

The Object Management Group (OMG), a not-for-profit technology standards consortium, proposed the UML standard in the mid-1990s. Grady Booch, Ivar Jacobson, and James Rumbaugh, known collectively as the “Three Amigos,” were key contributors to its formation.

Each of these three was influential in software engineering methodologies before they combined their ideas into a unified language.

UML was officially adopted by the OMG in 1997.  

Expansion of UML and Activity Diagrams

Activity Diagrams are one of the 14 diagrams defined by UML 2.0, an upgrade to the original standard.

The other diagrams are class, object, use case, sequence, communication, interaction overview, timing, state, composite structure, component, deployment, package, and profile diagram.  

Key Activity Diagram Details

Elements that can be part of an Activity Diagram can include the following:

  • Activities: These are the functions or operations within a system. Rounded rectangles represent them.
  • Transitions: These are represented by arrows that connect activities, illustrating the flow from one activity to another. The arrows can also represent the transition of data, objects, or signals between activities.
  • Start Node: This is the workflow’s initial state or beginning. A filled circle represents it.
  • End Node: This is the workflow’s final state or conclusion. It’s represented by a filled circle surrounded by a hollow circle.
  • Decision Node: It’s used to represent a test or decision. The node has one incoming arrow and multiple outgoing arrows, each labeled with a condition or guard. The process’s path depends on the outcome of the test or decision. A diamond shape represents it.
  • Merge Node: This node brings together multiple flows into one. It’s used to bring together different decision paths. A diamond shape also represents it.
  • Fork Node: This node splits a single flow into multiple concurrent flows. It’s depicted by a horizontal or vertical bar.
  • Join Node: It synchronizes multiple concurrent flows. It’s also represented by a horizontal or vertical bar.
  • Object Nodes: These are instances of data appearing within the workflow. They are represented by rectangles, often containing the name of the object.
  • Swimlanes: These are optional and are used to organize activities based on the object or entity that performs them. They can be horizontal or vertical and are often named.

In an Activity Diagram, the flow of control is represented by flow lines, which are typically arrows from one activity to another.

The direction of the arrow represents the flow direction. Activities can occur sequentially or concurrently, or they can be dependent on a condition.  

Evolution of Activity Diagrams

The Activity Diagram has significantly evolved since its early forms.

In UML 1.x, activity diagrams were a specialized form of state diagrams.

In UML 2.0, they were reformulated based on Petri net-like semantics, enhancing their capabilities for modeling complex activities.  

Use Cases of Activity Diagrams

Activity Diagrams are extensively used in business process modeling and process flow management, often in combination with other diagram types.

For instance, a Use Case diagram might represent high-level business processes, and then activity diagrams could be used to delve into the details of individual functions.  

Conclusion

Activity diagrams, which are part of UML, have been used to visualize the behavior of various systems, from business processes to operating systems to embedded hardware.

They are a flexible and powerful tool for understanding, communicating, and documenting system behavior.

Overview of Activity Diagram components – 12 mins

YouTube player