Navigation

Related Post
Data Analysis
Data analysis is the process of examining, organizing, and interpreting data to find useful information and support decision-making. In IT, data analysis is used to extract meaning from large volumes of digital data by using specialized tools and methods.
Data analysis often involves collecting data from databases, spreadsheets, or software applications and transforming it into formats that are easier to understand. Analysts then apply logical or statistical techniques to detect trends, patterns, or anomalies. This process helps businesses and organizations make more informed choices, predict outcomes, and improve performance. With modern computing power, data analysis can be performed quickly on massive datasets, making it a powerful part of today’s digital landscape.
Data Collection and Preparation
Before analysis can begin, raw data must be gathered from different sources, such as databases, cloud systems, or business applications. This stage is often handled with tools like SQL (Structured Query Language), Microsoft Excel, or Python scripts. The goal is to pull data in a structured and consistent format.
Once collected, the data must be cleaned and prepared. This includes removing duplicates, correcting errors, filling in missing values, and formatting the data into a usable state. Data preparation ensures the analysis will produce accurate and trustworthy results.
Analytical Techniques
Data analysis can involve simple techniques like sorting and filtering, or more advanced methods like regression, clustering, and time-series analysis. These techniques allow analysts to spot relationships between variables or changes over time.
Software tools like Microsoft Power BI, Tableau, and Python libraries (such as pandas and matplotlib) help analysts apply these techniques visually or through code. These tools make complex data more accessible and easier to interpret.
Visualization and Reporting
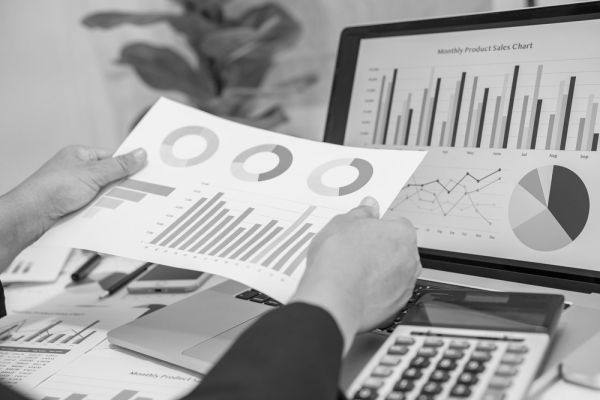
One of the most important steps in data analysis is presenting the findings. Visualization tools turn numbers into charts, graphs, and dashboards that show patterns clearly. This helps decision-makers grasp the insights quickly.
Programs such as Tableau, Power BI, and Google Data Studio are widely used to build interactive dashboards and custom reports. These visuals are especially helpful when sharing data with others who may not have technical backgrounds.
Automation and Real-Time Analysis
Data analysis is often automated using scripts, cloud tools, or data pipelines. These systems can perform continuous analysis in real time, which is valuable for monitoring operations or detecting problems as they happen.
Automation is commonly managed through platforms like Apache Spark, Microsoft Azure, or AWS. These platforms allow companies to scale their analysis efforts across large data volumes and multiple users simultaneously.
Security and Data Governance
When working with data, especially sensitive or personal information, security and governance are essential. Organizations must follow privacy regulations and use access controls to ensure only authorized users can view or analyze specific data sets.
Tools like data encryption, audit logs, and role-based access control (RBAC) help protect information. At the same time, governance frameworks such as GDPR or HIPAA provide rules to keep data handling ethical and lawful.
Conclusion
Data analysis is vital in helping organizations make sense of the information they collect daily. Analysts can deliver insights that support smarter decisions and better outcomes by combining structured data, specialized tools, and proven techniques.
Whether through simple charts or advanced machine learning models, data analysis continues to grow as a core function of IT.
A Beginner’s Guide To The Data Analysis Process – 10 mins
